Home >> Waves, electromagnetic waves
e/m spectrum |
||
Electromagnetic Spectrum
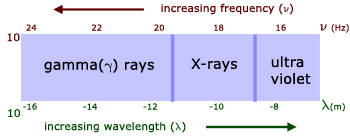

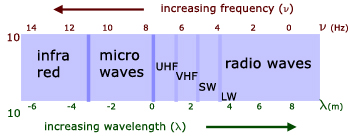
γ(gamma)-rays
generation :
1. nuclear fission
2. nuclear fusion
3. radioactive decay
4. elementary particle interactionsproperties :
1. very penetrating
2. produce weak ionization
3. produce weak fluorescence
4. affect photo filmdetection :
1. Geiger-Muller tube
2. scintillation counter
3. solid state detectors
4. photo film
X-rays
generation :
1. electron deceleration
2. electron energy level changes in atomsproperties :
1. ionizing
2. affect photo film
3. penetrating
4. produces fluorescence
5. can produce photoelectric emissiondetection :
1. Geiger-Muller tube
2. scintillation counter
3. solid state detectors
4. photo film
ultraviolet
generation :
electron energy level changes in atomsproperties :
1. produces ionisation, fluorescence
2. initiates chemical reactions
3. absorbed by plate glass
4. produces the photoelectric effect
5. affects photo filmdetection
1. photo film
2. photoelectric cell
3. fluorescent materials
visible
generation :
electron energy level changes in atomsproperties :
1. starts chemical reactions (eg photosynthesis)
2. affects photo filmdetection :
1. photoelectric cell
2. photo film
3. solid state detectors (eg CCD)
4. vision
5. light dependent resistor (LDR)
infrared
generation :
1. molecular vibration
2. electron energy level changes in atomsproperties :
1. transfer of heat energy to materials
2. modulation for short distance control (eg TV remotes)detection :
1. CCD devices
2. thermopile
3. special photo film
microwaves
generation :
1. from magnetrons, klystrons & masers
2. from red-shifted light from stars & galaxiesproperties :
1. modulation of waves for communication
2. resonance with molecules, producing heatdetection :
1. directional aerials, parabolic dishes
2. solid state arrays
radio waves
generation :
1. electrons oscillating
2. red-shifted lower wavelengths from stars etc.properties :
waves can be modulated for communicationdetection :
1. aerials, parabolic dishes
2. solid state arrays
Absorption & Emission Spectra
Very simply, emission spectra are obtained by viewing light directly. The light is made entirely of emission spectra. That is spectra that are either continuous bands of colour, lines or bunched lines of colour.
On the other hand, absorption spectra are obtained by viewing light through an intervening, translucent substance. Absorption spectra are simply emission spectra with discrete vertical black lines across them.
The explanation is to do with electron energy levels within atoms.
Emission spectra are simply discrete wavelengths emitted by atoms when excited electrons fall to lower energy levels.

The wavelength λ is given in terms of the energy level change E2 - E1 by the equation:
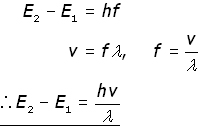
where h is Planck's constant
Note that the energy level change is inversely proportional to the wavelength. In other words, a large energy change produces a short wavelength and vice versa.
When a light beam passes through say a cloud of gas, the electrons in atoms of the gas absorb some of its energy at particular wavelengths. The electrons are then excited to higher energy levels.
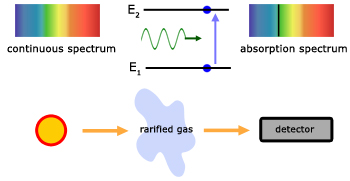
Viewing the light after it has passed through the gas reveals black absorption lines. These are evidence of the missing wavelengths of light that were absorbed by the gas atoms.
Line Spectra
Line spectra are produced by low density monatomic (single atom) gases and vapours. In this scenario there are no interactions between neighbouring atoms.
Both emission and absorption spectra, as described earlier, are examples of line spectra.

a mercury vapour emission spectrum
The black absorption spectra are sometime called Fraunhofer lines after Joseph Von Fraunhofer, who first discovered them in the solar spectrum.

a section of the solar spectrum
Band Spectra

spectrum of air
Bands are groups of spectral lines, staggered so they are closer on one side than the other.
Unlike line spectra, bands are produced by molecules, not single atoms. Like line spectra, the material must be in the gaseous or vapour state.
The relative molecular mass(RMM) of the material has some bearing on how close together the lines are.
Low RMM has the effect of spreading lines out.
A high RMM tends to compress them.
Continuous Spectra
Hot gases emit many wavelengths because they often contain many different kinds of atoms and these are all in different excited states. Atoms also interact between each other as a result of their close proximity. So all the individual emission lines merge to appear as one continuous band of colour.
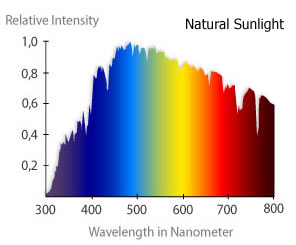
image courtesy of Reef Keeping Fever
Note the jagged nature of the curve. This is a result of absorption caused by the Sun and the Earth's atmosphere.
Interpolating the results, the most intense colour is green. So not surprisingly our eyes are more adapted to that colour.
The overall shape of the curve is that of a 'black body' radiator.
[ About ] [ FAQ ] [ Links ] [ Terms & Conditions ] [ Privacy ] [ Site Map ] [ Contact ]
